Climate Change and Wildfire Risk in Western U.S.
Wildfires that occurred over the western United States during August 2012 were fewer in number but larger in size when compared with all other Augusts in the twenty-first century. This unique characteristic, along with the tremendous property damage and potential loss of life that occur with large wildfires with erratic behavior, raised the question of whether future climate will favor rapid wildfire growth so that similar wildfire activity may become more frequent as climate changes. This study addresses this question by examining differences in the climatological distribution of the Haines index (HI) between the current and projected future climate over the western United States. The HI, ranging from 2 to 6, was designed to characterize dry, unstable air in the lower atmosphere that may contribute to erratic or extreme fire behavior. A shift in HI distribution from low values (2 and 3) to higher values (5 and 6) would indicate an increased risk for rapid wildfire growth and spread. Distributions of Haines index are calculated from simulations of current (1971- 2000) and future (2041-70) climate using multiple regional climate models in the North American Regional Climate Change Assessment Program. Despite some differences among the projections, the simulations indicate that there may be not only more days but also more consecutive days with HI >= 5 during August in the future. This result suggests that future atmospheric environments will be more conducive to erratic wildfires in the mountainous regions of the western United States.
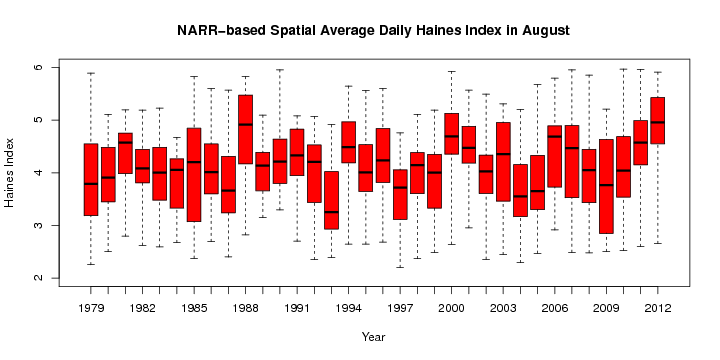
FIG. 1. Distribution of NARR-based spatially averaged HI at 0000 UTC of each day in August from 1979 to 2012. At each 0000 UTC, the HI values at each grid point are spatially averaged over the Wyoming, Idaho, and Montana border region (43°-47.5°N, 113°-106°W), and then the distribution of the 31 daily values within each August is summarized with one boxand-whisker plot. The bar in each box is the monthly mean, the upper and lower bounds of the box are the upper and lower quartiles, and the whiskers extend to the extreme values
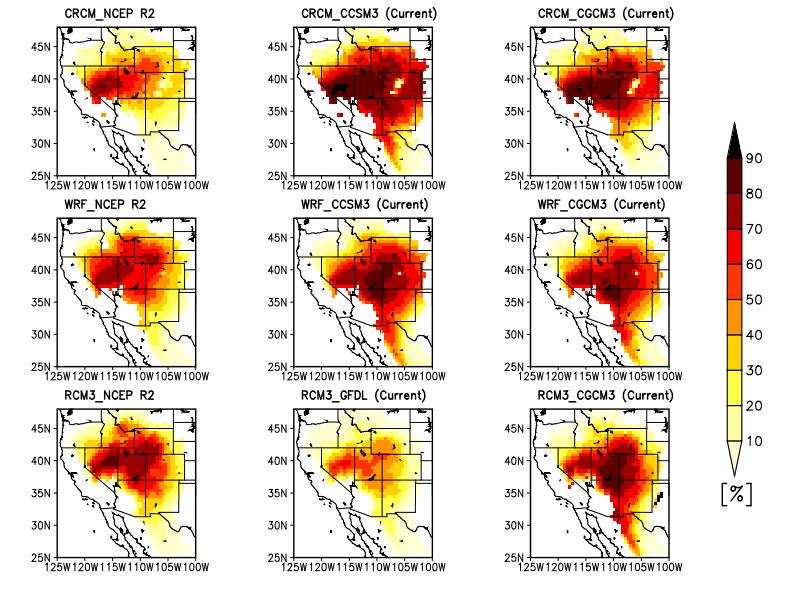
FIG. 2. Percentage of days during August for which HI >= 5 over the high-elevation regions in the western United States as simulated by the (top) CRCM, (middle) WRF, and (bottom) RCM3 models driven by (left) R-2, (center) CCSM3, and (right) CGCM3 fields. For RCM3, CCSM3 is replaced by the GFDL model. The HI is calculated using information at 0000 UTC of each day in August for the current (1971-2000) climate.
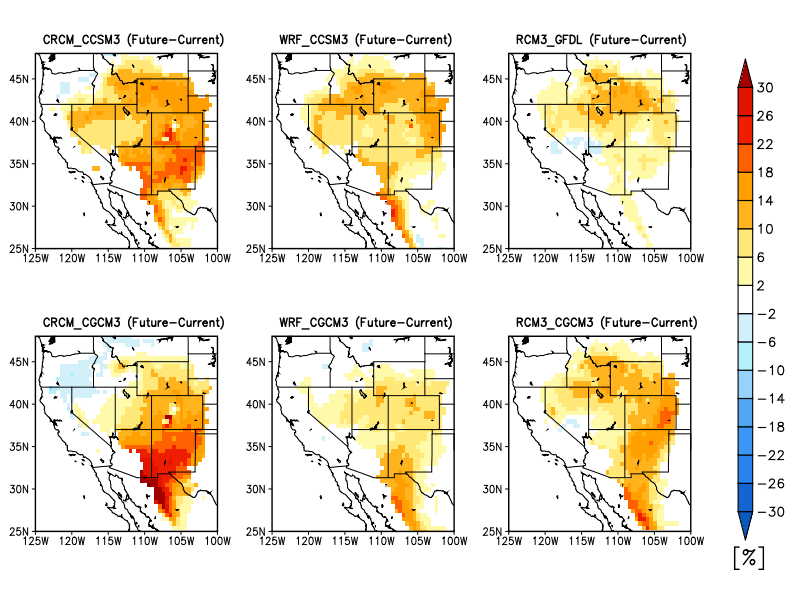
FIG. 3. Changes in the percentage of days for which HI >= 5 during August between the current and the future climate as simulated by the (left) CRCM, (center) WRF, and (right) RCM3 models driven by the (top) CCSM3 and (bottom) CGCM3 fields. For RCM3, CCSM3 is replaced by the GFDL model. The HI is calculated using information at 0000 UTC of each day in August for the current (1971-2000) and future (2041-70) climates.
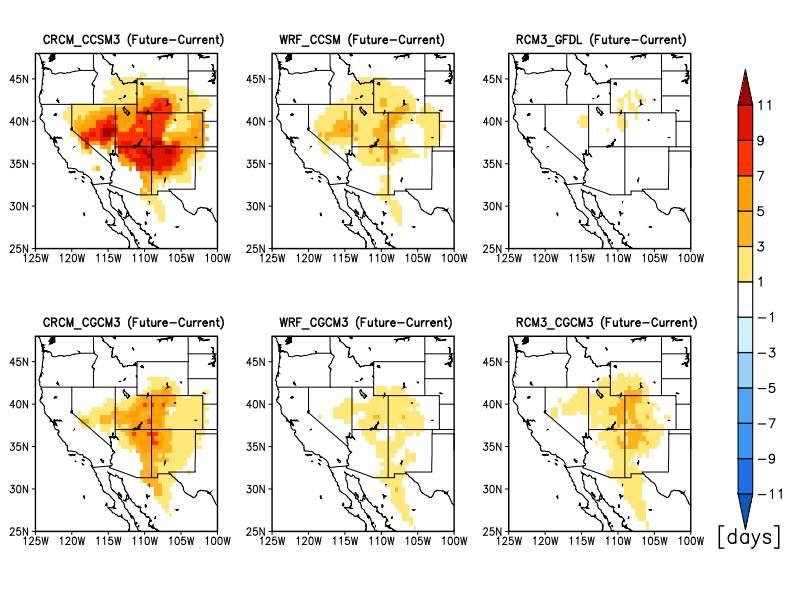
FIG. 4. As in Fig. 3, but for changes in the average length of consecutive days with HI>= 5.
Reference
- Luo, L., Y. Tang, S. Zhong, X. Bian, W. E. Heilman (2013), Will future climate favor more erratic wildfires in the western United States? Journal of Applied Meteorology and Climatology, 52, 2410- 2417. doi: 10.1175/JAMC-D-12-0317.1
- Tang, Y., S. Zhong, L. Luo, J. Winkler, X. Bian, and W.E. Heilman (2015), The Potential Impact of Regional Climate Change on Fire Weather in the United States, Annals of the Association of American Geographers, 105:1, 1-21, doi:10.1080/00045608.2014.968892.
- Heilman, WE. Y Tang, L. Luo, S. Zhong, J. Winkler, X. Bian (2015), Potential climate change impacts on fire weather in the United States. Fire Management Today. 74(3): 22-27.