Contribution of Temperature and Precipitation Anomalies to the 2012-2015 California Drought
The recent multiyear drought over California was characterized by large precipitation deficits and abnormally high temperatures during both wet and dry seasons. This study investigates and quantifies the contributions of precipitation and temperature anomalies to the development of the multiyear drought with a set of modeling experiments where the anomalies are either removed or randomly replaced with other historical observations. The study reveals that precipitation deficits have been largely responsible for producing the extreme agricultural drought (i.e., large soil moisture deficits) while warmer temperatures have only marginally intensified the drought. However, the warmer temperatures over the high-elevation areas during the wet season have contributed equally or more than the precipitation deficits to the reduction of snowpack. The interplay between temperature and precipitation anomalies in space and time also appears to be important for the drought development.
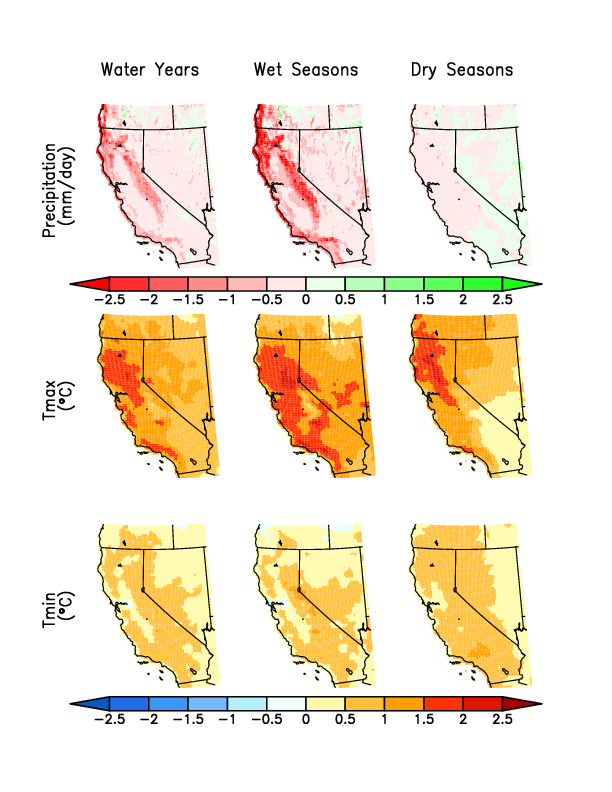
FIG. 1. Anomalies of (top row) precipitation, (middle row) daily maximum temperature, and (bottom row) daily minimum temperature over the study region during (left column) the four water years (October 2011 to September 2015), (middle column) the wet seasons (November to April), and (right column) the dry seasons (May to September). This is based on the NLDAS-2 hourly forcing at 1/8 ∘ resolution. The climatology is based on the 37 year period of 1979 to 2015.
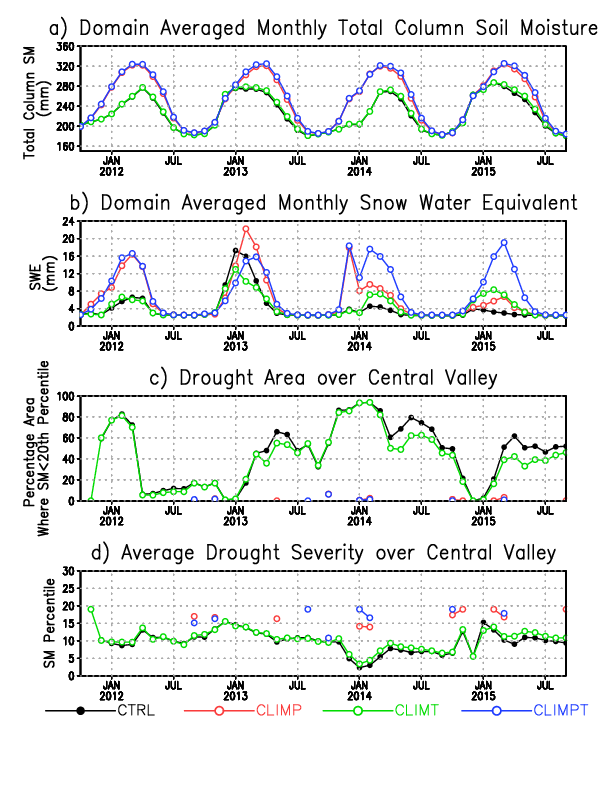
FIG. 2. Time series of (a) basin-averaged total column soil moisture, (b) snow water equivalent (SWE), (c) percentage area, and (d) average severity of agricultural drought over Central Valley from CTRL, CLIMP, CLIMT, and CLIMPT simulations. The drought area is represented by the percentage area of the Central Valley where the monthly total column soil moisture is below the 20th percentile of its climatological distribution, and the average severity is represented by the averaged soil moisture percentile of the grids in drought. A lower soil moisture percentile indicates a more severe drought. Missing values in the CLIMP and CLIMPT time series correspond to months when no grid cell is in drought.
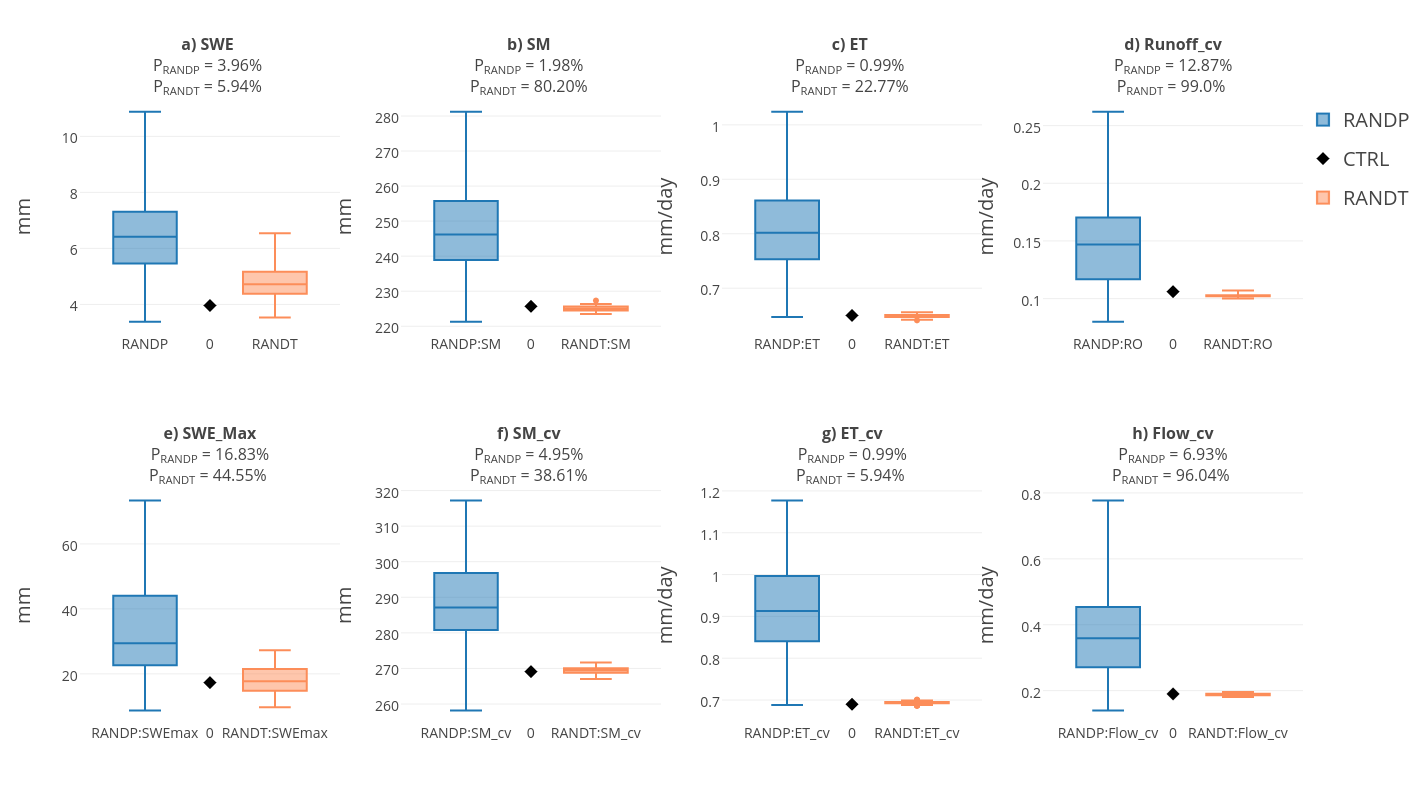
FIG. 3. Distributions of various metrics from the RANDP (blue) and RANDT (orange) ensemble experiments represented by box-and-whiskers along with the metric value from the CTRL simulation (black diamonds). The box encloses the interquartile range with the median inside, and the whiskers extend out to the maximum or minimum value. (a–c) SWE (snow water equivalent), SM (soil moisture), and ET (evapotranspiration) are averaged over all 48 months and over the entire study domain. (f and g) SM and ET are also averaged only over the Central Valley. (d and h) Basin-averaged runoff and streamflow are averaged over the Central Valley. (e) SWE_max is similar to SWE (Figure 3a) except that it is only averaged over the maximum of each year.
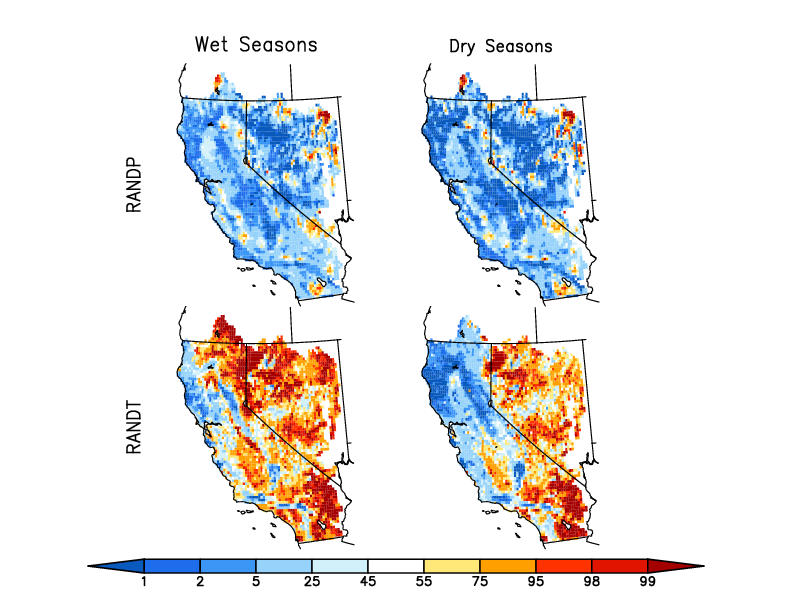
FIG. 4. The exceedance probabilities of soil moisture drier than that from the CTRL simulation in the (top row) RANDP and (bottom row) RANDT ensemble experiments. This is calculated for the (left column) wet seasons and (right column) dry seasons separately. Similar values between the two rows suggest that both temperature and precipitation anomalies are responsible for the extreme drought statistically.
Reference
- Luo, L., D. Apps, S. Arcand, H. Xu, M. Pan, and M. Hoerling (2017), Contribution of temperature and precipitation anomalies to the California drought during 2012–2015, Geophys. Res. Lett., 44, 1–9, doi:10.1002/2016GL072027.