Forecast Evaluation
Using seasonal drought forecasts that were issued between April 6, 2011 and January 21, 2016 on every Wednesday, we evaluate our seasonal drought prediction system to determine its forecast skills relative to the baseline ESP forecast. This page provides an interface to visually compare our CFSv2-based drought forecast with "observations" and with ESP-based forecast. The following figures summarize some of the evaluations in a more concise way.
For a given forecast, we can first need to quantify how similar the predicted drought condition over CONUS is to the analysis. This can be achieved by calculating the spatial correlation and the root-mean-square error (RMSE) between two spatial fields at a given time. Obviously both the correlation and RMSE depend on the lead time. The following figure shows the spatial correlation between the predicted drought condition (ensemble mean on a given day) and the drought analysis (offline simulation driven by observed NLDAS2 forcing). A higher spatial correlation indicates a stronger similarity between the predictied drought map and the analysis. As we currently only run the forecast for a 120-day period following the initial condition on every Wednesday, and the evaluation is based on the predicted drought conditions on the 17 Wednedays within each forecast.
It is clear that CFSv2-based forecast show higher spatial correlation and smaller RMSE than the ESP-based forecast for all lead times (See figure below).
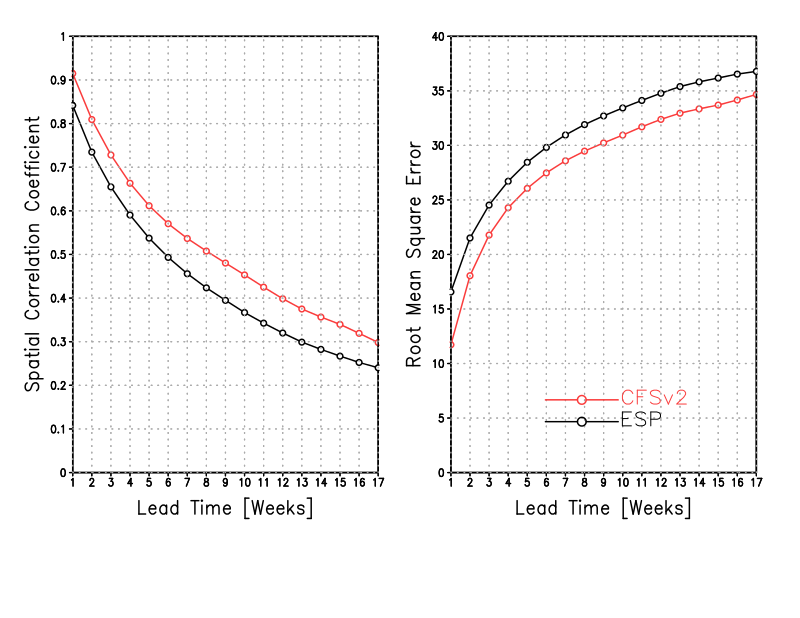
Figure 1: Spatial correlation and RMSE of SMI (soil moisture index, expressed as the percentile of total column soil moisture) forecast verified against analysis.
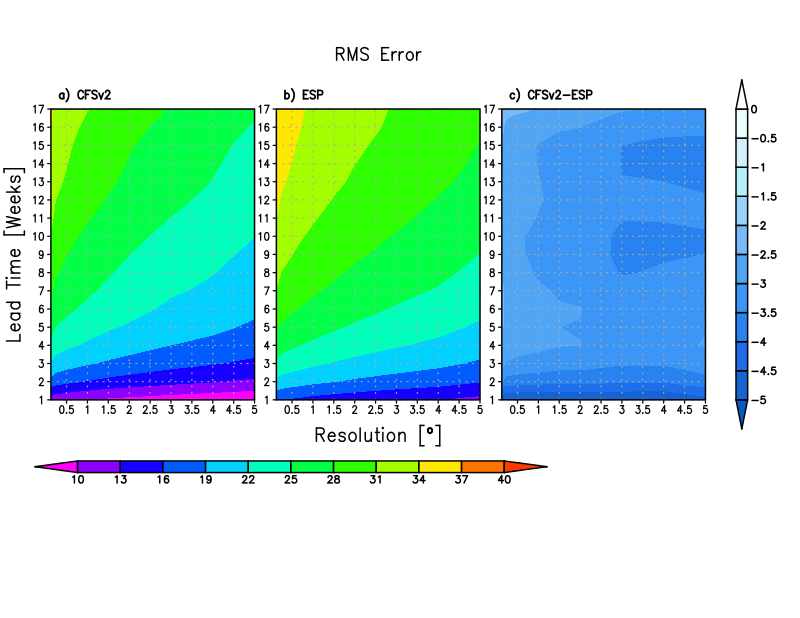
We also regrid both forecast and analysis to coarser resolutions before calculating the spatial correlation and RMSE in order to elliminate the mismatches at fine scales. The x-axis in the figures below is the spatial resolution (0.125, 0.25, 0.5, 1, 1.5, 2,2.5,3,4,5 degrees). From the right panels, it is clear that CFSv2-based forecast consistently outperforms the ESP-based forecast when measured by spatial correlation (CFSv2 shows higher resolution) and RMSE (CFSv2 shows smaller RMSE).
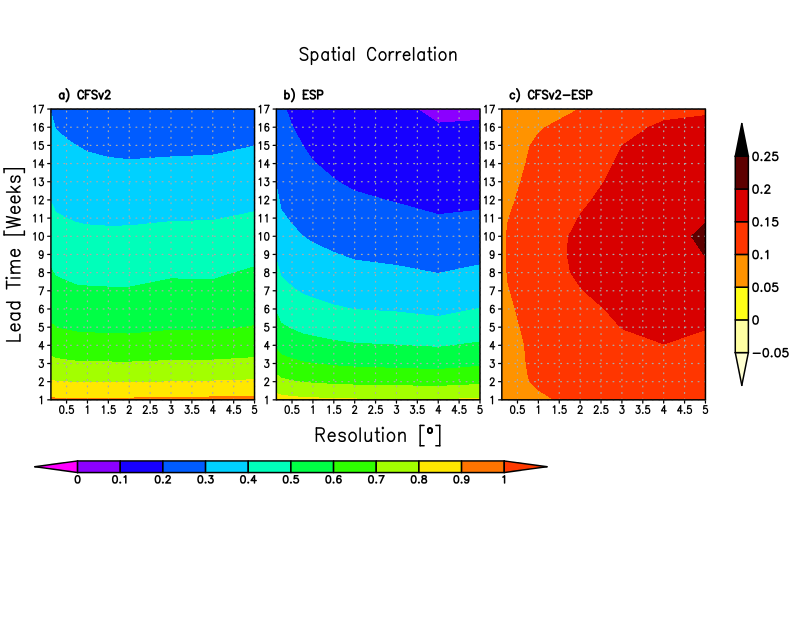
Figure 2: Variation of spatial correlation with lead time and spatial resolution.